
Last updated: June 2026
TL;DR: The number one organic Google result receives between 27.6% and 39.8% of all clicks, but that figure drops sharply when AI Overviews appear on the page [GLOBAL, Backlinko 2025 / First Page Sage 2026]. Google Ads in Kenya averages KES 15 to 150 per click for retail and services, with real estate keywords running KES 130 to 260+ (Nairobi Web Experts, 2026). Africa-level email open rates average 33.18% and CTR averages 2.29% (GetResponse, 2024); AM Digital KE client accounts across Kenya outperform the CTR benchmark at 3.2%.
Methodology note:
This page compiles digital marketing performance benchmarks relevant to Kenyan businesses in 2026.
- Where public Kenya-specific data exists, it is cited directly from CA Kenya, DataReportal, StatCounter, and Nairobi Web Experts.
- Where no Kenya-specific public benchmark exists, global benchmarks from named studies are used and labelled [GLOBAL].
- Each [GLOBAL] figure is followed by a Kenya interpretation.
- AM Digital KE client data callouts are clearly labelled and drawn from Kenyan accounts managed by AM Digital KE as of 2026.
- Benchmark sources include Backlinko, First Page Sage, GrowthSRC, Ruler Analytics, GetResponse, Socialinsider, Plausible Analytics, WordStream, and Ryze AI. This page is updated quarterly.
Here is the table of contents incase you want to view everything at a glance.
Benchmarks at a Glance
| Metric | Benchmark | Context | Source |
|---|---|---|---|
| Position 1 organic CTR | 27.6%–39.8% | Global, range reflects studies with/without AI Overviews | Backlinko 2025 / First Page Sage 2026 |
| Top 3 organic results click share | 68.7% | Global, top 3 captures nearly 7 in 10 clicks | First Page Sage, 2026 |
| Position 1 CTR with AI Overview present | ~19% | Global, down from 28% in 2024 | GrowthSRC, 2025 |
| Average lead gen conversion rate | 2.9% | Global, across 14 industries and 100M+ data points | Ruler Analytics, 2026 |
| Organic search conversion rate | 2.6% | Global, highest-intent inbound channel | Ruler Analytics, 2026 |
| Paid search conversion rate | 1.5% | Global | Ruler Analytics, 2026 |
| Google Ads CPC, Retail/Services (Kenya) | KES 15–130 | Kenya-specific | Nairobi Web Experts, 2026 |
| Google Ads CPC, Real Estate (Kenya) | KES 130–260+ | Kenya-specific | Nairobi Web Experts, 2026 |
| Google Ads CPC, E-commerce (Kenya) | KES 60–150 | Kenya-specific | Nairobi Web Experts, 2026 |
| Email open rate, Africa | 33.18% | Africa-level benchmark | GetResponse, 2024 |
| Email CTR, Africa | 2.29% | Africa-level benchmark | GetResponse, 2024 |
| Email open rate, AM Digital KE Kenya accounts | 24.5% | Kenya client data | AM Digital KE, 2026 |
| Email CTR, AM Digital KE Kenya accounts | 3.2% | Kenya client data | AM Digital KE, 2026 |
| TikTok engagement rate | 3.40%–3.73% | Global | Socialinsider, Q1 2026 |
| Instagram engagement rate | 0.45%–0.48% | Global | Socialinsider, Q1 2026 |
| Facebook engagement rate | 0.15% | Global | Socialinsider, Q1 2026 |
| Website bounce rate, B2B | 25%–65% | Global | Plausible Analytics, 2026 |
| Website bounce rate, Retail/e-commerce | 20%–55% | Global | Plausible Analytics, 2026 |
| Website bounce rate, Blog/content | 65%–90% | Global | Plausible Analytics, 2026 |
Organic CTR by Google Position
A keyword that ranks at position 1 and a keyword that ranks at position 6 can have identical monthly search volume and deliver completely different traffic. CTR is where search volume becomes real visitors.
| Position | Backlinko 2025 [GLOBAL] | First Page Sage 2026 [GLOBAL] | GrowthSRC 2025, post-AI Overview [GLOBAL] |
|---|---|---|---|
| Position 1 | 27.6% | 39.8% | 19% |
| Position 2 | 15.8% | 18.7% | 12.6% |
| Position 3 | 11.0% | 10.2% | — |
| Position 4 | — | 7.2% | — |
| Position 5 | — | 5.1% | — |
| Top 3 combined | — | 68.7% of all clicks | — |
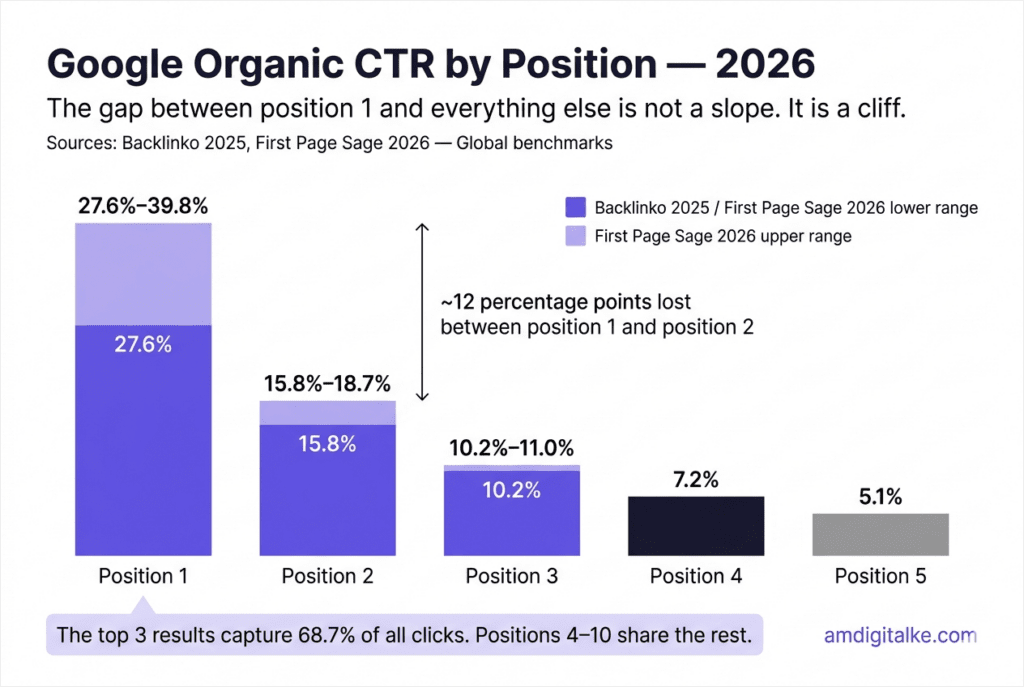
Three studies, three different numbers for position 1. They are all correct. They measure different things.
First Page Sage’s 39.8% reflects clean SERPs without AI Overviews, skewed toward high-intent and branded queries. Backlinko’s 27.6% is the broader average across a larger, more diverse dataset of 4 million results.
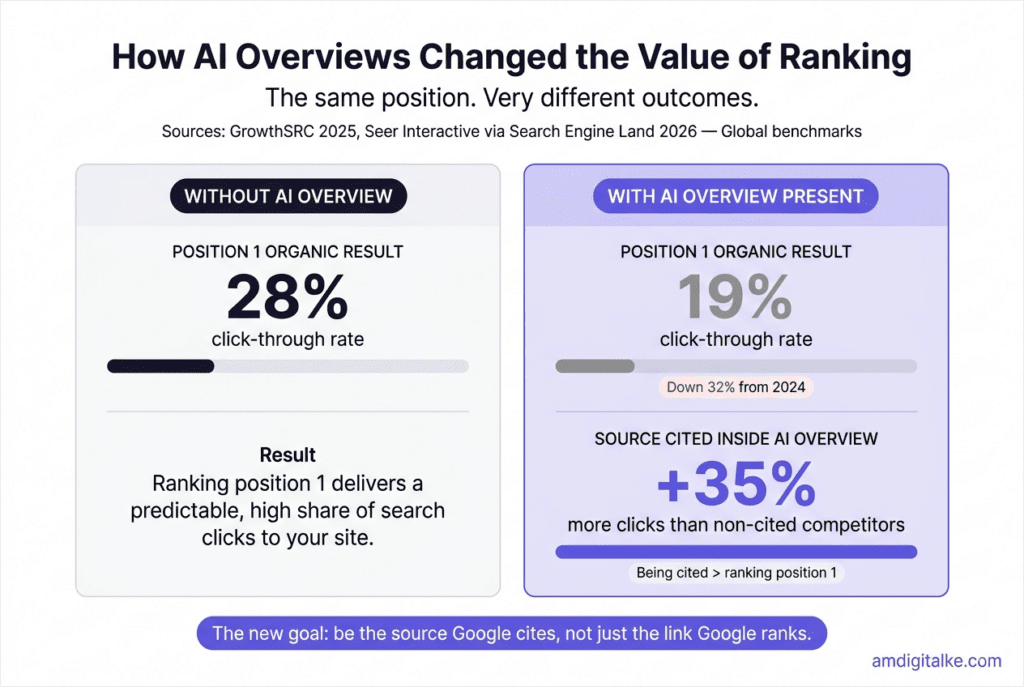
GrowthSRC’s 19% is what position 1 delivers on queries where an AI Overview is present, drawn from a study of 200,000 keywords tracking the before and after of the 2025 AI Overview rollout.
Position 1 CTR fell from 28% to 19% over that period. That is a 32% decline in one year.
Use the range when setting traffic projections, not a single number.
A keyword with local commercial intent and no AI Overview present should be projected closer to the Backlinko range.
A broad informational keyword where Google is likely to surface an AI answer should be projected closer to the GrowthSRC figure.
The zero-click story has a second half.
Sites cited inside AI Overviews receive 35% more clicks than non-cited competitors on the same query [GLOBAL, Seer Interactive via Search Engine Land, 2026].
The ranking goal is shifting from position 1 to citation 0.
Kenya interpretation: Google AI Mode launched in Kenya on 21 August 2025. These CTR shifts are now active in the Kenyan market.
Kenyan businesses that are building structured, authoritative, entity-clear content now are competing for citation inside AI Overviews, not just for a blue link at the top of the page.
That is a different competition with a different set of rules, and most Kenyan competitors have not caught up yet.
Website Engagement Benchmarks
No public Kenya-specific bounce rate data exists at the time of publication. Global benchmarks from Plausible Analytics (2026) are used as the directional baseline.
Each figure is followed by a Kenya context note.
| Industry / Page Type | Bounce Rate Benchmark [GLOBAL] | Source |
|---|---|---|
| Retail / e-commerce | 20%–55% | Plausible Analytics, 2026 |
| B2B services | 25%–65% | Plausible Analytics, 2026 |
| Real estate | 30%–55% | Plausible Analytics, 2026 |
| Legal / professional services | 50%–70% | Plausible Analytics, 2026 |
| Blog / content pages | 65%–90% | Plausible Analytics, 2026 |
| Landing pages | 60%–90% | Plausible Analytics, 2026 |
A 75% bounce rate on a blog post is normal. A 75% bounce rate on a pricing page is a conversion problem. The number is meaningless without knowing which page type it is attached to.
Benchmark against the right category.
Kenya context: page speed is a more significant bounce driver in Kenya than in higher-bandwidth markets.
4G covers 97.3% of the population, but actual download speeds vary significantly between urban Nairobi and rural Kisumu.
A page that loads in 2 seconds in Westlands may take 4 to 5 seconds on a rural connection. At 4 seconds, more than half of mobile users leave (Google PageSpeed data).
Core Web Vitals are not just a Google ranking signal in Kenya. They are a Kenya revenue signal.
Based on AM Digital KE client data across Kenyan accounts, B2B service pages in competitive Nairobi markets outperform the global B2B benchmark when the page includes a visible WhatsApp CTA above the fold.
WhatsApp reduces friction at the exact moment a visitor has a question. It keeps them in the funnel instead of bouncing to search for an alternative.
Conversion Rate Benchmarks
No Kenya-specific public conversion rate data exists at the time of publication. Global benchmarks from Ruler Analytics (2026), based on 100 million+ data points across 14 industries, are used as the baseline.
| Channel | Average Conversion Rate [GLOBAL] | Source |
|---|---|---|
| Organic search | 2.6% | Ruler Analytics, 2026 |
| 2.4% | Ruler Analytics, 2026 | |
| Paid search | 1.5% | Ruler Analytics, 2026 |
| Paid social | 0.9% | Ruler Analytics, 2026 |
| AI search referral (ChatGPT, Perplexity, Gemini) | 3.49% | DigitalApplied, 2026 |
| Overall average, lead gen | 2.9% | Ruler Analytics, 2026 |
Organic search converts at 2.6%. Paid search converts at 1.5%. That gap persists across studies and industries because intent is structurally different.
Someone who searched “seo company nairobi” and clicked an organic result was actively looking.
Someone who saw a Google Ad while searching for something adjacent was not. Higher intent produces higher conversion, and organic search captures the highest-intent traffic.
The AI referral figure is worth noting. Traffic arriving from ChatGPT, Perplexity, or Gemini converts at 3.49%, roughly 22% higher than traditional organic search [GLOBAL, DigitalApplied 2026].
The reason is pre-qualification. An AI engine that recommends a business to a user has already filtered the query, evaluated the options, and decided to surface that result.
The user arrives with a warm recommendation, not a cold click. ChatGPT holds 0.5% of Kenya’s search traffic today. The conversion quality of that channel is already worth tracking.
Kenya interpretation: the global conversion benchmarks above assume credit card and form-based checkout flows.
In Kenya, the conversion path often ends in a WhatsApp message or an M-Pesa payment, not a form submission.
Based on AM Digital KE client data across Kenyan accounts, lead generation pages with WhatsApp as the primary conversion point consistently outperform equivalent pages using only form fills.
If you are measuring conversions in Google Analytics and only tracking form submissions, you are likely undercounting real conversions by 30 to 50%.
Response speed matters more here than most benchmarks capture. Leads contacted within 5 minutes of enquiry close at 32% versus 12% after 24 hours (2026 lead response data).
In a market where WhatsApp is the primary communication channel, a business that replies to an enquiry at 9am Monday when the message arrived Friday evening has already lost the sale to the competitor who replied in 20 minutes.
Google Ads Costs in Kenya
This is the strongest Kenya-native section on this page. All CPC figures are in KES and sourced from Kenyan market data.
Kenya CPC Benchmarks
| Industry | Average CPC (KES) | Monthly Ad Budget Range | Source |
|---|---|---|---|
| Retail / General Services | KES 15–130 | KES 30,000–80,000/month | Nairobi Web Experts, 2026 |
| Real Estate | KES 130–260+ | KES 50,000–150,000+/month | Nairobi Web Experts, 2026 |
| E-commerce | KES 60–150 | KES 30,000–100,000/month | Nairobi Web Experts, 2026 |
| Google Ads management fee (additional to ad spend) | KES 25,000–45,000/month | — | Nairobi Web Experts, 2026 |
Global CPC Context (for Kenya comparison)
| Industry | Global Average CPC [GLOBAL] | Kenya comparison |
|---|---|---|
| Legal services | USD 6.75–8.58 (~KES 870–1,100) | Kenya legal CPCs are significantly lower |
| Real estate | USD 2.37 (~KES 305) | Kenya real estate CPCs exceed this global average |
| E-commerce | USD 1.16 (~KES 150) | Kenya aligns with global at the upper end |
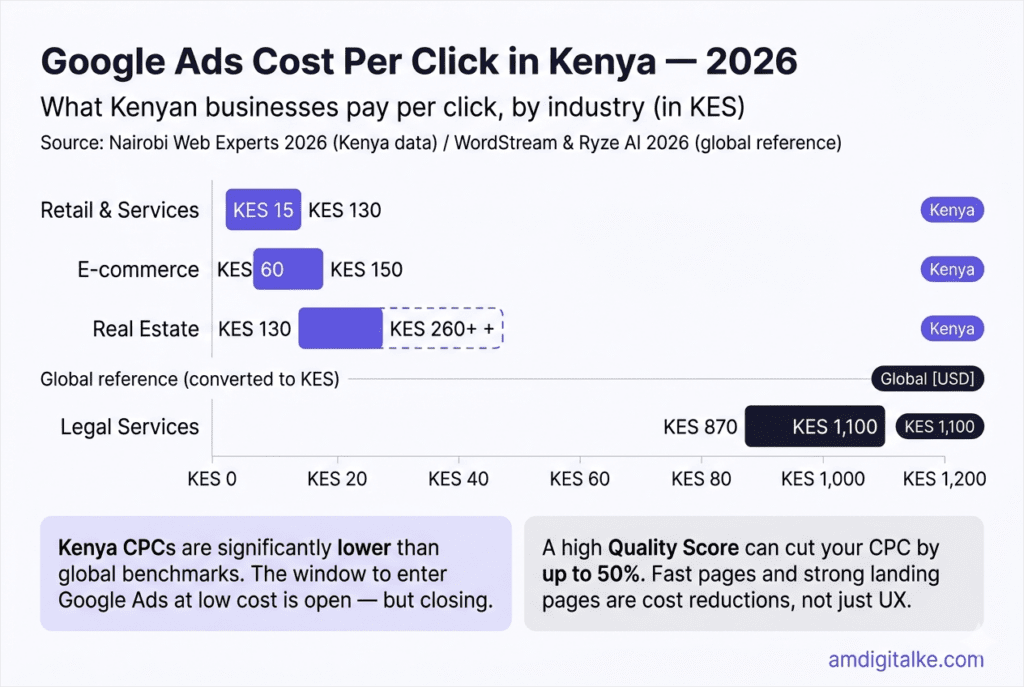
Kenya is a light-competition paid search market. A legal services keyword that costs USD 6.75 to 8.58 per click in the US costs a fraction of that here.
The gap exists because fewer Kenyan law firms are running Google Ads. The firms that start now capture conversions at a lower cost per lead than they will in two years when the market is more saturated.
Real estate in Kenya runs against the global pattern. Kenya real estate CPCs exceed the global USD 2.37 average because local demand is high, inventory is finite, and the transaction values justify aggressive bidding.
If you are a property developer or agent in Kilimani, Westlands, or Karen, you are competing for clicks with other well-funded businesses who understand what a single sale is worth.
Quality Score is the most underused cost lever in the Kenyan market.
A high Quality Score, achieved through fast pages, relevant ad copy, and strong alignment between the ad and the landing page, can cut your CPC by up to 50% (Nairobi Web Experts, 2026).
Most Kenyan businesses running Google Ads are paying more per click than they need to. The fix is not more budget. It is better infrastructure.
One thing that catches our new advertisers: the management fee is not the ad spend. If an agency quotes KES 35,000 per month, that is their fee. Ad spend is separate and paid in advance to Google.
A basic Google Ads campaign in Kenya costs KES 55,000 to 125,000 all-in when management fee and ad budget are combined. Budget accordingly.
Email Marketing Benchmarks
| Metric | Africa Benchmark | AM Digital KE Kenya Accounts | Source |
|---|---|---|---|
| Average open rate | 33.18% | 24.5% | GetResponse 2024 / AM Digital KE 2026 |
| Average CTR | 2.29% | 3.2% | GetResponse 2024 / AM Digital KE 2026 |
| Click-to-open rate (CTOR) | 6.90% | — | GetResponse, 2024 |
| Unsubscribe rate | 0.14% | — | GetResponse, 2024 |
| Email bounce rate | 2.57% | — | GetResponse, 2024 |
Open rate is the least reliable metric in email marketing right now, and has been since 2022.
Apple’s Mail Privacy Protection auto-loads email images for Apple Mail users regardless of whether the email was actually opened.
Africa’s average open rate of 33.18% from GetResponse includes this inflation. CTR and click-to-open rate are the more reliable signals of genuine engagement.
AM Digital KE client accounts across Kenya show an open rate of 24.5% against the Africa benchmark of 33.18%. On face value that looks like underperformance.
The CTR tells the opposite story.
AM Digital KE Kenya accounts average a 3.2% CTR against the Africa benchmark of 2.29%.
A smaller, more actively engaged list outperforms a larger passive list that inflates opens through automatic image loading.
What does 3.2% CTR mean in real numbers. If your list has 1,000 subscribers and you send twice a month, 32 people are clicking through to your site or landing page per send.
That is 64 qualified visits per month from people who already know your business, at near-zero incremental cost per visit. Compare that to the cost of 64 paid search visits at KES 50 to 130 per click.
List hygiene matters more than send volume. A clean, permission-based list of 500 people who genuinely opted in will outperform a purchased list of 5,000 cold contacts every time.
In Kenya, where the ODPC is now actively fining businesses for unsolicited marketing, building an opt-in list is not just a best practice. It is a compliance requirement.
Social Media Benchmarks
Platform Reach in Kenya
| Platform | Kenya Users | Notes | Source |
|---|---|---|---|
| Social media identities (total) | 18.4 million | 31.8% of population | DataReportal, 2026 |
| TikTok (18+ users) | 18.4 million | 78.5% of internet user base | DataReportal / TikTok ad data, 2026 |
| LinkedIn (registered members) | 6.3 million | 19.2% of 18+ population | DataReportal, 2026 |
| 90%+ of internet users daily | Primary communications channel | Multiple Kenya sources, 2026 |
Engagement Rate Benchmarks
| Platform | Engagement Rate [GLOBAL] | AM Digital KE Kenya Accounts | Source |
|---|---|---|---|
| TikTok | 3.40%–3.73% | — | Socialinsider, Q1 2026 |
| 0.45%–0.48% | — | Socialinsider, Q1 2026 | |
| 0.15% | — | Socialinsider, Q1 2026 | |
| X (Twitter) | 0.12% | — | Socialinsider, Q1 2026 |
| Average across AM Digital KE accounts | — | 4.8% | AM Digital KE, 2026 |
The AM Digital KE 4.8% average engagement rate across managed Kenyan accounts outperforms the global TikTok benchmark of 3.40 to 3.73% and sits far above the Instagram and Facebook global averages.
This is not a platform advantage. It is a content execution advantage.
Educator-first carousels built for a Kenyan business owner audience, with Kenya-specific examples and a consistent brand voice, outperform generic content regardless of which platform it is published on.
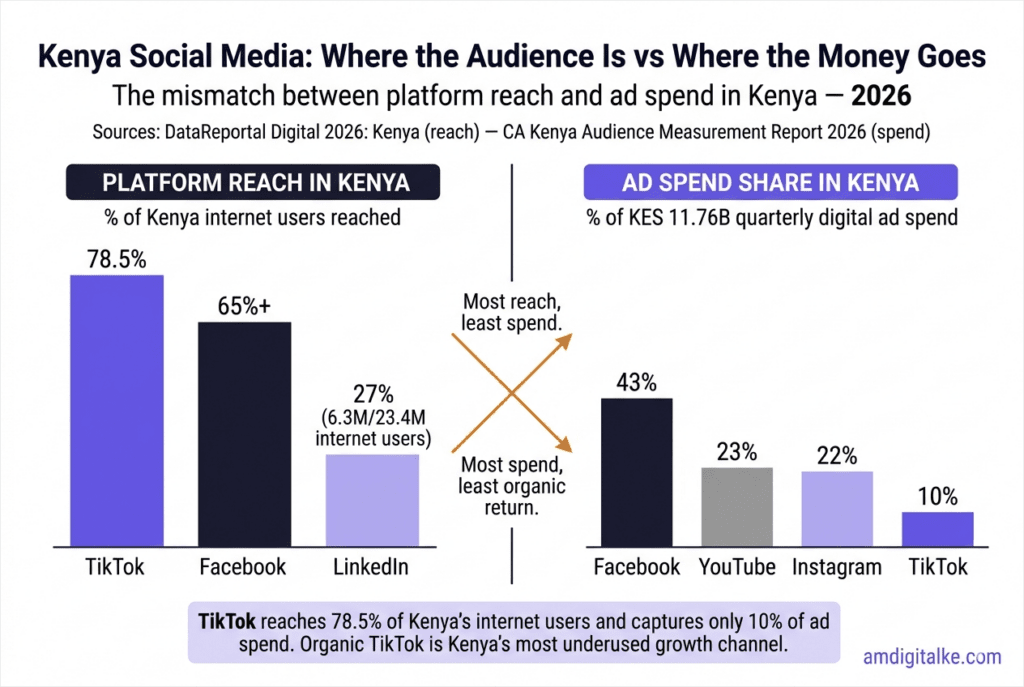
The Facebook paradox: Facebook captures 43% of Kenya’s digital ad spend (CA Kenya, 2026) while delivering the lowest organic engagement rate of any major platform at 0.15% (Socialinsider, Q1 2026).
Kenyan businesses are collectively spending the most money on the platform that delivers the least organic return.
The implication is not to leave Facebook. It is to stop expecting organic performance from a pay-to-play channel and to treat it as the paid reach vehicle it has become.
TikTok represents the biggest mismatch in the Kenyan social media market. TikTok reaches 78.5% of Kenya’s internet user base (DataReportal, 2026).
It captures only 10% of Kenya’s digital ad spend (CA Kenya, 2026).
Organic TikTok in Kenya is one of the highest-leverage, lowest-cost growth channels available to any Kenyan business with a content strategy right now. That gap will close.
The businesses moving now will have audience and authority before the CPC market matures.
WhatsApp is where the conversion happens. Social media creates awareness and drives consideration. WhatsApp closes the sale. A user who sees your carousel on Instagram is exploring.
A user who sends you a WhatsApp message has crossed into buying intent. Build your social media strategy to generate WhatsApp conversations, not just website clicks, and measure it that way.
How to Use These Benchmarks
Your benchmark is your own last period
A 1.8% conversion rate is underperformance for a legal services firm (industry benchmark: 7.4%) and strong performance for a cybersecurity company (benchmark: 1.0%).
Cross-industry averages are useful for initial orientation. For ongoing decision-making, the most actionable benchmark is your own performance last quarter.
Are your numbers moving in the right direction? That question matters more than whether you beat a global study conducted in California.
Single-channel benchmarks hide the full picture
Ruler Analytics tracked 100 million+ data points across 14 industries and found organic search converts at 2.6%. That figure changes entirely based on traffic source composition.
A site with 60% branded organic traffic will show a higher conversion rate than an identical site with 60% paid social traffic. Before benchmarking your conversion rate, understand your traffic mix.
Two businesses with the same overall conversion rate can have wildly different underlying performance depending on what is bringing the traffic in.
Kenya is not a global average
Every benchmark on this page labelled [GLOBAL] was measured primarily in US, European, and Australian markets. Kenyan consumer behaviour is different.
Payment methods are different. M-Pesa, not credit cards. WhatsApp, not web forms. Connectivity conditions are different. 97.3% 4G coverage does not mean uniform download speeds across the country.
Device mix is different. 50/50 desktop and mobile, not 70/30 mobile.
Use global benchmarks as directional indicators, not targets. Where AM Digital KE client data is available on this page, use that as your Kenya-specific baseline.
Frequently Asked Questions
What is a good organic CTR for position 1 in 2026?
Position 1 organic CTR ranges from 19% to 39.8% depending on the type of query and whether an AI Overview appears on the results page [GLOBAL]. Backlinko’s study of 4 million results puts the average at 27.6%. First Page Sage’s 2026 analysis puts it at 39.8% for clean SERPs. GrowthSRC found that position 1 CTR dropped to 19% on queries where AI Overviews were present. Use the lower range when projecting traffic for informational keywords and the higher range for high-intent commercial or branded terms.
What is the average Google Ads CPC in Kenya?
Google Ads CPC in Kenya averages KES 15 to 130 for retail and general services, KES 60 to 150 for e-commerce, and KES 130 to 260+ for real estate (Nairobi Web Experts, 2026). These figures are significantly lower than global benchmarks in the same categories, reflecting Kenya’s still-developing paid search ecosystem. Competition is increasing. Businesses that start Google Ads campaigns now will build Quality Score history and account structure while CPCs are still relatively low.
What is a good email open rate for Kenya?
The Africa-level benchmark from GetResponse (2024) puts the average open rate at 33.18%, but this figure is inflated by Apple Mail Privacy Protection, which auto-loads email images regardless of whether the recipient actually opened the email. A more reliable signal is click-through rate, where the Africa benchmark sits at 2.29%. Based on AM Digital KE client data across Kenyan accounts, a well-managed Kenyan email list achieves around 3.2% CTR, which outperforms the Africa benchmark despite a lower headline open rate.
What is a good social media engagement rate for Kenya?
Global benchmarks put TikTok at 3.40% to 3.73% engagement, Instagram at 0.45% to 0.48%, and Facebook at 0.15% (Socialinsider, Q1 2026). Based on AM Digital KE client data across Kenyan accounts, a well-executed content strategy targeting Kenyan business owners achieves an average engagement rate of 4.8% across platforms, outperforming the global TikTok benchmark. Kenya-specific content built around real local examples consistently outperforms globally generic content.
What is the average website conversion rate in Kenya?
No public Kenya-specific conversion rate data exists at time of publication. Global benchmarks from Ruler Analytics (2026), based on 100 million+ data points, put the average lead generation conversion rate at 2.9% across all channels. Organic search converts at 2.6%, email at 2.4%, paid search at 1.5%, and paid social at 0.9%. In Kenya specifically, these figures should be adjusted to account for WhatsApp as a primary conversion path. If you are only tracking form submissions, you are likely undercounting real conversions significantly.
Want more data about SEO and marketing in Kenya? Check out the page on State of SEO in Kenya 2026.
Get a Free SEO Analysis
These benchmarks tell you what the market looks like. A free SEO analysis tells you where your business stands inside it and what to fix first.
AM Digital KE: Every Piece We Move is By Design amdigitalke.com